If you’ve read the blog posts on CloudJourney.io before, you’ve likely come across the term “Continuous Verification”. If not, no worries. There’s a solid article from Dan Illson and Bill Shetti on The New Stack that explains it in detail. The short version: Continuous Verification means putting as many automated checks as possible into your CI/CD pipelines. More checks, fewer manual tasks, more data to smooth out and improve your development and deployment process.
So far we covered the tools and technologies, Continuous Integration, and Infrastructure as Code aspects of the ACME Serverless Fitness Shop. This post is about observability.
What is the ACME Serverless Fitness Shop #
Quick recap: the ACME Serverless Fitness Shop combines two of my favorite things — serverless and fitness. It has seven distinct domains, each with one or more serverless functions. Some are event-driven, others have an HTTP API, and all of them are written in Go.
What is Observability #
Cloud-native apps have fundamentally changed how we design, build, and run systems. They need to adapt to change rapidly, be resilient, and work at scale. Whether you’re running microservices on Kubernetes or as serverless functions, some companies have hundreds of services in production with thousands of deployments per day. That growing complexity makes one of the biggest challenges figuring out how and where things go wrong.
Wikipedia describes observability as “a measure of how well internal states of a system can be inferred from knowledge of its external outputs”.
In distributed systems, observability typically has three pillars: logs, metrics, and traces.
Logs are the (usually immutable) records an app sends somewhere to be stored. The ACME Serverless Fitness Shop uses AWS CloudWatch Logs for this. CloudWatch Logs gives you a single place to find logs from all components — API Gateway messages, Lambda function output, everything. The data is automatically indexed and queryable, which makes finding that needle in the haystack a lot easier.
Metrics are the numerical values you measure. There are different types: current values (like CPU load), counters (like concurrent executions), and so on. Within VMware Tanzu Observability by Wavefront, you can track all of these.
Traces represent the events flowing through your system from service to service. An end-to-end trace starts at the first entry point (usually the UI), tracks every service it touches, and records how long each call took. The article “How to Use Tracing to Analyze Your Applications” gives a good overview of using tracing to find outliers, errors, and traffic patterns.
Adding VMware Tanzu Observability by Wavefront #
Adding Wavefront observability to the ACME Serverless Fitness Shop is straightforward:
package main

import (
	"github.com/aws/aws-lambda-go/events"
	"github.com/aws/aws-lambda-go/lambda"
	wflambda "github.com/retgits/wavefront-lambda-go" // Import this library
)

var wfAgent = wflambda.NewWavefrontAgent(&wflambda.WavefrontConfig{})

func handler() (string, error){
	return "Hello World", nil
}

func main() {
	// Wrap the handler with wfAgent.WrapHandler()
	lambda.Start(wfAgent.WrapHandler(handler))
}
I used a slightly modified version of this Go code (also available on GitHub) that also reports memory usage. Beyond the code change, you need two environment variables in your deployment:
WAVEFRONT_URL: The URL of your Wavefront instance (like,https://myinstance.wavefront.com).WAVEFRONT_API_TOKEN: Your Wavefront API token (see the docs how to create an API token).
The Pulumi deployment adds these environment variables to the function arguments. In the Payment service, they’re created on lines 156 and 157 and added to the function on line 171. Once deployed, data flows into Wavefront on every function execution.
Generating some load #
With the functions sending data to Wavefront, the next step is generating some traffic. There are plenty of load testing tools out there — pick whatever works for you. I went with Gotling, a Go-based variant of Gatling. The config below hits two functions (get all products and get product), picking a random product ID from the first call for the second. Using random data helps limit caching effects.
---
iterations: 20
users: 2
rampup: 2
actions:
- http:
title: Get all products
method: GET
url: https://<api id>.execute-api.us-west-2.amazonaws.com/Prod/products
accept: json
response:
jsonpath: $.data[*].id
variable: product
index: random
- sleep:
duration: 3
- http:
title: Get a single random products
method: GET
url: https://<api id>.execute-api.us-west-2.amazonaws.com/Prod/products/${product}
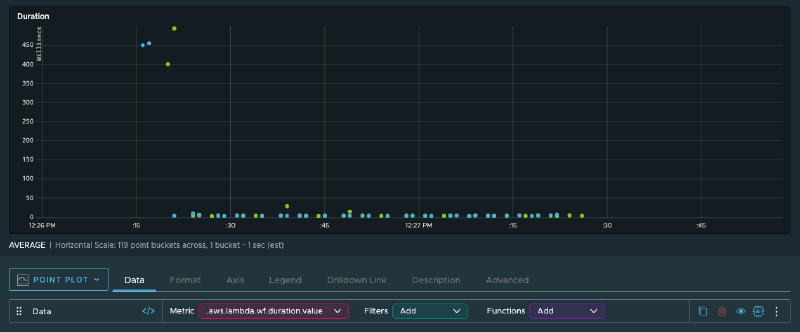
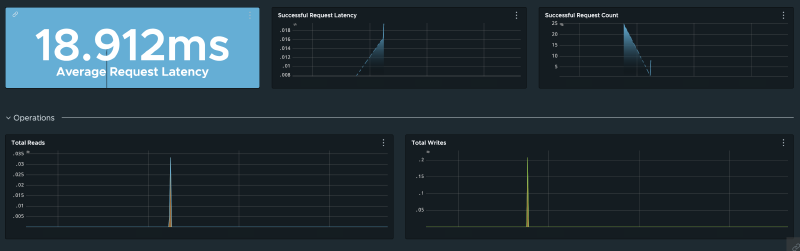
accept: jsonGraphs #
With metrics flowing into Wavefront, you can start observing how your system behaves. The Lambda function duration graph shows that the first executions take significantly longer — around 450 milliseconds. Those are cold starts. The rest of the invocations are well below the 100-millisecond billing threshold, so there’s no immediate need to optimize.
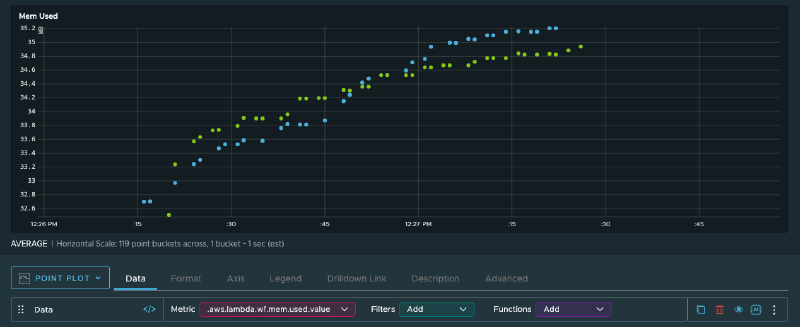
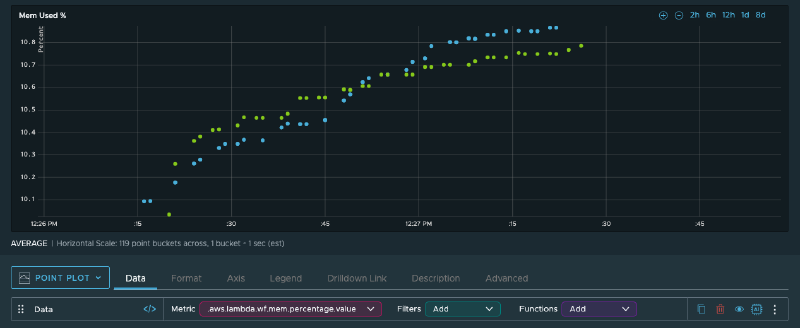
Memory usage ranges between 32 and 36 MB. The functions have 256 MB available, so there’s plenty of headroom. Combined with the sub-100ms execution times, there’s no real reason to powertune these functions.
Lambda isn’t the only component worth monitoring. Wavefront can track all the infrastructure and app metrics that AWS and your apps emit — DynamoDB query result counts, capacity units consumed, SQS queue depth, oldest message age, and more.
This brings me to one of my favorite Wavefront features: alerts. Instead of staring at dashboards all day, you can set up alerts for specific conditions — too many messages in a queue, too many read capacity units consumed, etc. Teams can use that data alongside traces, logs, and error tracking to decide what needs attention.
What’s next? #
That wraps up the observability side of the ACME Serverless Fitness Shop. Let me know what you’d like to see next.
Cover image by ThisIsEngineering from Pexels